Updated/reviewed by the authors, July 2017.
Optical Coherence Tomography in Age-related Macular Degeneration
Authors:
Garcia-Layana, Alfredo1
Ciuffo, Gianfranco1
Javier Zarranz-Ventura2
Alvarez-Vidal, Aurora1
1 Ophthalmology Department. Clínica Universidad de Navarra.
Pamplona. Spain
2 Institut Clínic d´Oftalmologia (ICOF); Hospital Clinic Barcelona; Barcelona; Spain
Introduction
Optical coherence tomography (OCT) technology allows the acquisition of cross-sectional images of the retina with semihistologic resolution.
It permits to define the location and nature of the changes in the retina and adjacent structures and objectively evaluates the thickness of the retina and surrounding structures.
These capabilities allow detection of newly emerging fluid and/or intraretinal or subretinal tissue and tissue below the retinal pigment epithelium
c. Neurosensory Retinal Detachment (RPE).
OCT provides important information on serous retinal detachments, hemorrhages and subretinal neovascular membranes that are components of exudative macular degeneration and allows a more precise and detailed analysis of anatomic structures and neovascular membrane lesions subtypes.
These capabilities facilitate an understanding of the differences between the classic membranes, occult membranes, retinal angiomatous proliferation (RAP) and disciform scars in the natural course of the disease and assess the response to anti-vascular endothelial growth factor (VEGF) drugs.
The images are presented in a color (or gray) scale based on the different reflectivity of the tissue structures.
More concisely, tissues that reflect more light or disperse more light are shown in red and white, respectively, while the ones that reflect or disperse less light are shown in blue and black.
Tissues that moderately reflect light are shown as green or yellow. It should be noted that the color shown in the images represents the optical properties of the tissues and not the tissues themselves.
Therefore, the image is not real but represents the true dimensions of the measured structures(1-10)
Normal eye
The vitreous transmits light without reflecting it and is depicted in black in OCT images (Figure 1). The posterior hyaloid usually is indistinguishable from the retinal surface except when the posterior vitreous is detached and appears as a weakly reflective band. The choriocapillaris and choroid are highly reflective layers, because they are vascular and limit light penetration into the deeper layers. Blood vessels are identified by their high reflectivity and the masking effect generated on adjacent tissues (Table 1) (7,8,11)
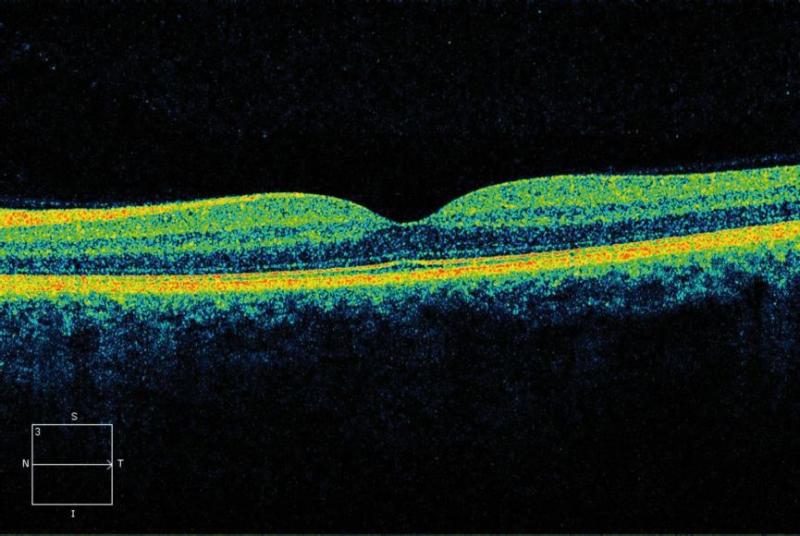
Figure 1. A normal eye.
|
Table 1. Reflectivity Patterns of the Retinal Structures in Normal Eyes
|
|
|
Hyperreflectivity pattern
|
Nerve fiber layer, thicker in the nasal portion (red), RPE and choriocapillaris (red)
|
|
Normalreflectivity pattern
|
Inner and outer plexiform layer (yellow-green), inner and outer nuclear layers (blue)
|
|
Hyporeflectivity pattern
|
Photoreceptor layer
|
Age-Related Maculopathy
Age-related maculopathy, which is currently considered a previous stage of age-related macular degeneration (AMD), is defined as the presence of areas of hyperpigmentation or hypopigmentation of the RPE and/or confluent or soft drusen. When soft drusen in the macular region are associated with focal areas of pigmentary changes (hypopigmentation and hyperpigmentation), there is an increased risk of progression to AMD. Drusen, which are degenera
c. Neurosensory Retinal Detachmenttive nodular formations located mainly in Bruch’s membrane, are accumulations of proteins, lipids, mucopolysaccharides and other components that appear in adulthood and tend to increase in size and number over time. Drusen is the earliest AMD sign that is detected clinically in fundus examinations. On OCT, drusen appear as RPE deformation or thickening that may form irregularities and undulations (Figure 2).
Drusen are classified histologically as hard formations, defined as small hyaline deposits with delimited margins that are considered age-related low-risk changes, and soft drusen, which are deposits of granular or amorphous material considered to be precursors of AMD. Drusen can progress to an atrophic form (dry) or exudative form (wet) of AMD. The risk is based on the lesion number, size and confluence of drusen. (4,6,8,12-15)
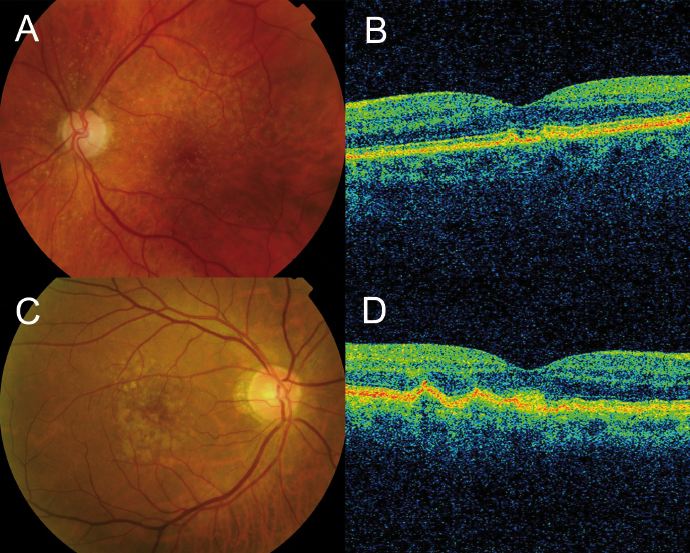
Figure 2. Drusen are seen as undulations and elevations in the hyperreflective band of the RPE with less reflective material beneath them, while the inner retinal layers remain generally intact.
Atrophic Macular Degeneration
In the macular region, progressive atrophy of the RPE, the outer retinal layers, the choriocapillaris, and dense clusters of In the macular region, progressive atrophy of the RPE, the outer retinal layers, the choriocapillaris, and dense clusters of drusen can be seen.
OCT can detect decreases in retinal thickness and increases in the reflectivity of the RPE detachment, which results from the decreased ability of the atrophic retinal tissue to attenuate light and allows greater penetration of the laser beam to deeper structures as the choroid (Figure 3). The reduced retinal thickness and volume can be determined by the retinal maps that display the areas of greatest atrophy, identify the extent of the atrophy, and monitor progression. Geographic atrophy (GA) represents the final stage of dry AMD. (6,8,10,16,17)
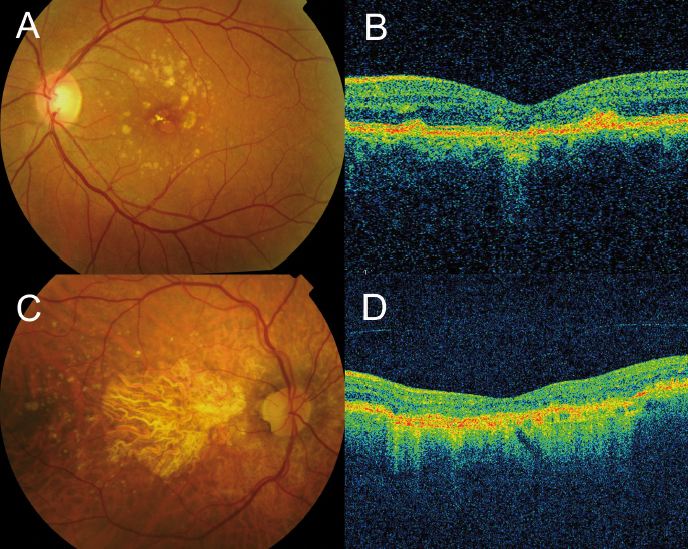
Figure 3. In a case of retinal atrophy, the OCT shows a highly reflective choroidal signal due to retinal thinning and RPE hypopigmentation, which allows greater beam penetration into the choroid and greater reflectivity. The retinal map allows quantification of the decreased retinal thickness.
Exudative Macular Degeneration
OCT, a fundamental tool in the diagnosis and management of patients with choroidal neovascularization (CNV), allows identification of active neovascular membranes and determination of the extent of the membranes in many cases. The technology is useful for the assessment of the subfoveal region and also helps diagnose occult choroidal neovascular (CNV) membranes, in which fluorescein angiography (FA) often shows confusing patterns. OCT has also been proven useful for monitoring treatment response to anti-VEGF agents and is a reliable tool to determine the need for retreatment in pro re nata (PRN) treatment regimes. (3,8,15,18-23)
Well-defined classic CNV appears on OCT as hyperreflective areas in contact with or in front of the RPE; the pathology may be dome-shaped or appear as a thin formation (fusiform or nodular) (Figure 4). Retinal edema is always present to some extent in front of the active membrane; if the retina is thinner than normal, new vessels may be latent. CNV is less evident a few weeks after onset, and only interruption, breakdown and pronounced thickening of the RPE can be seen.
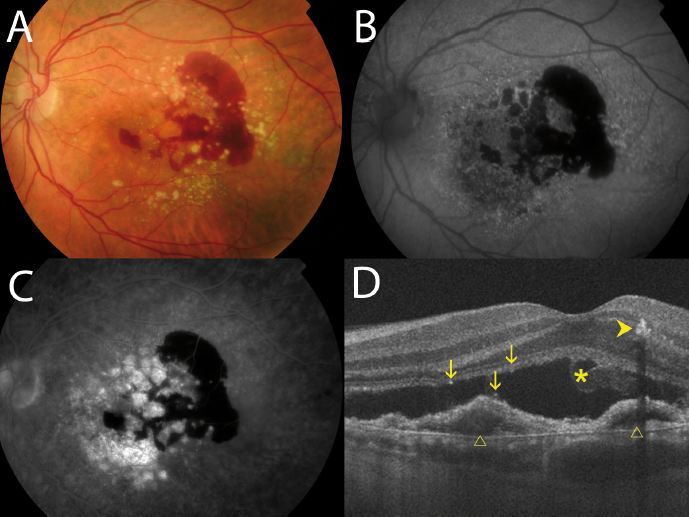
Figure 4. OCT visualizes the components of the neovascular membrane, a RPE detachment (PED), neurosensorial detachment, intraretinal fluid and subretinal haemorrhage. D: Drusenoid PEDs (∆), subretinal hemorrhage (*), dense particles present in the subretinal fluid (↓), intraretinal migration of RPE cells (>).
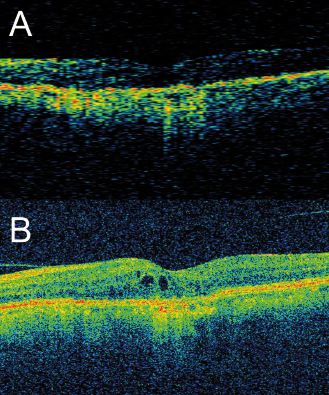
RPE Detachment
a. Hemorrhagic Detachment
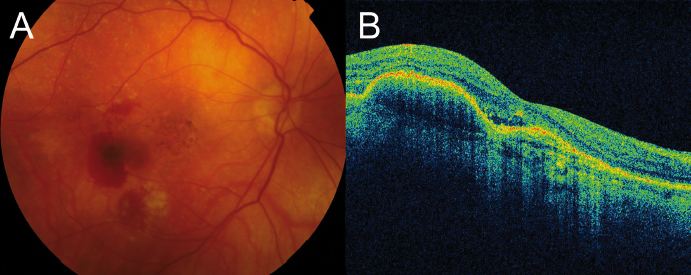
Figure 5. Hemorrhagic detachment of the RPE.
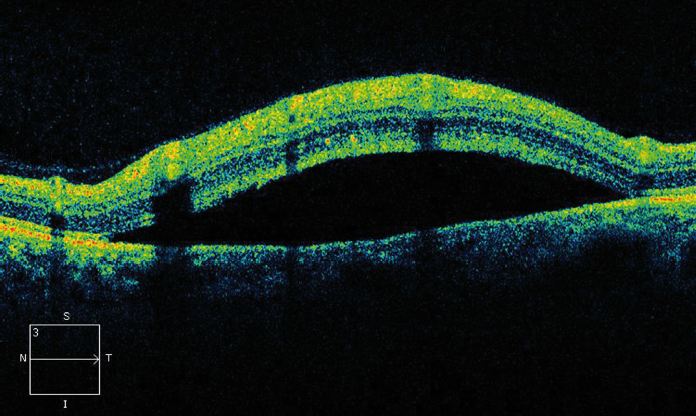
b. Serous Detachment
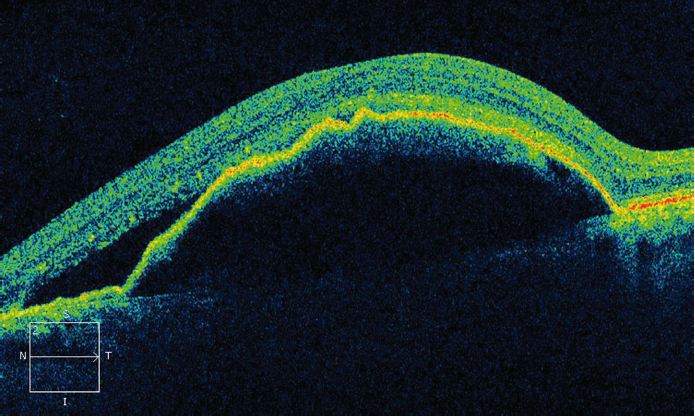
Figure 6. Serous detachment of the RPE associated with a neurosensory retinal detachment.
c. Neurosensory Retinal Detachment
Intraretinal Fluid
Intraretinal fluid can occur either diffusely, creating increased retinal thickness and reduced retinal reflectivity, or appear localized in non-reflective well defined cysts (cystic macular edema) (Figure 8).
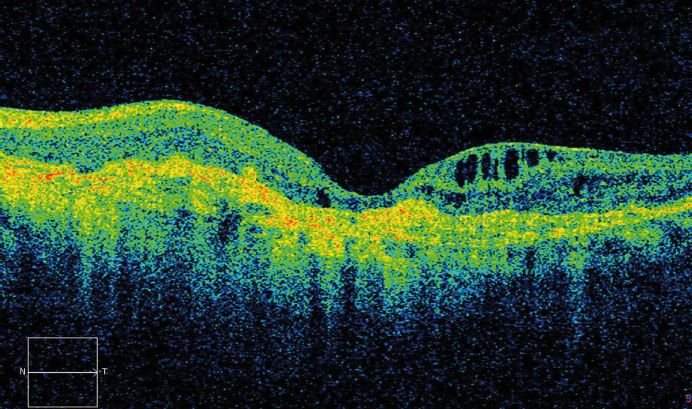
Figure 8. Intraretinal cysts.
RPE Rips
RPE rips are serious complications of AMD and appear during the evolution of serous or serohemorrhagic PEDs (Figure 9). RPE rips also can be secondary to photodynamic therapy (PDT) and laser photocoagulation. Patients with occult CNV membranes and PEDs are at high risk of developing RPE rips, being the PED base diameter and the PED height the main risk factors for this complication, which is estimated to appear in 17% of the cases.(6,8,25)
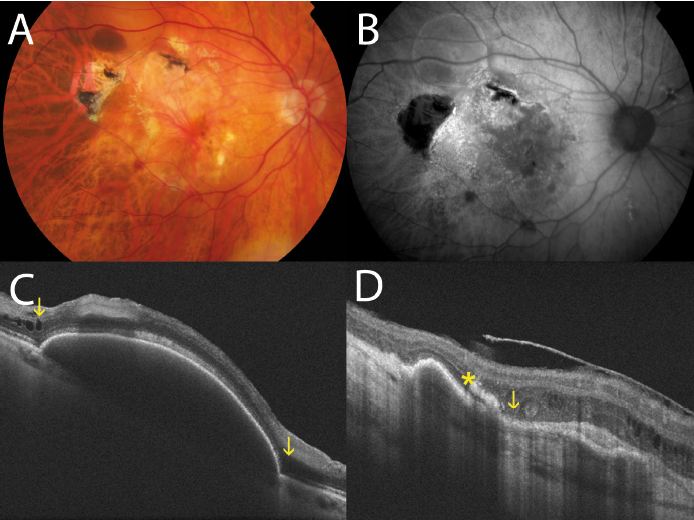
Figure 9. RPE tears, sudden disruptions in the continuity of the hyperreflectivity layer of the pigment epithelium, show strong reflectivity from the choroid in the absence of the pigment epithelium, followed by sudden interruption of the band’s pigment epithelial hyperreflectivity. C: (↓) Intraretinal fluid. D: (↓) RPE interruption site, (*) RPE tear bent over itself.
Polypoidal Choroidal Vasculopathy
Polypoidal choroidal vasculopathy (PCV) is considered a variant of neovascular AMD with serous or hemorrhagic detachment of the retina and the RPE in the posterior pole. The pathology is seen on FA and especially on indocyanine green angiography (ICGA). Both tests show dilated vessels in the choroid layer with the characteristic presence of polypoidal structures which usually occur at the termini of vessels at the edge of the vascular network (Figure 10).(8,24-27)
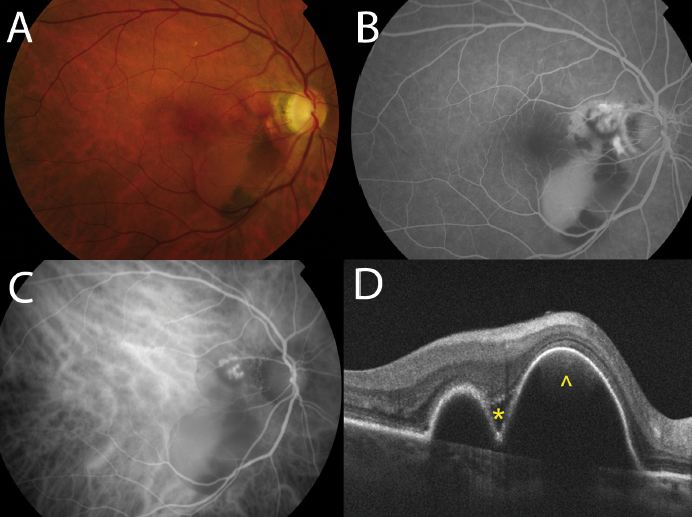
Figure 10. PCV case. A: Color photography shows hemorrhagic PED. B: FA shows the PED and signs of occult CNV. C: ICGA shows the presence of hot spots corresponding to polypoidal structures. D: OCT shows small cup-shaped RPE elevations corresponding to PCV; subretinal fluid (*) and blood under the RPED (^).
Retinal Angiomatous Proliferation (RAP)
Retinal angiomatous proliferation (RAP) is a particular type of intraretinal neovascularization consisting of vascular anastomosis of aberrant retinal vessels. In choroidal neovascular membranes, new vessels proliferate through the RPE and infiltrate the retina and eventually communicate with the retinal circulation to produce retinochoroidal anastomosis. In RAP, the neovascularization originates in the same retinal vessels. The diagnosis is based on the presence of hyperfluorescent points corresponding to the areas of neovascularization (hot spot) in ICGA images, and the presence of dilated retinal vessels associated with multiple intraretinal, preretinal or subretinal hemorrhages, with varying degrees of intraretinal edema in the fundus examination. A proposed three-stage classification is seen in Table 2.
|
Table 2. RAP Stages |
|
|
1
|
Proliferation of intraretinal capillaries originating from the deep capillary network in the macular area
|
|
2
|
Presence of retinal-retinal anastomosis and intraretinal edema and a possible association with a PED and/or subretinal neovascularization
|
|
3
|
Retinal-choroidal anastomosis and emergence of new choroidal vessels
|
Disciform scars
Disciform scars are the end-stage of exudative AMD in which the retinal tissue is replaced by scar tissue (usually vascularized). Disciform scars develop with regression of subretinal hemorrhages and retinal edema and hyperplasic elements of the RPE. Disciform scars are usually dry and show marked destruction of all retinal layers. It is less common to find diffuse exudation with elevation of the entire sensory retina at the posterior pole (Figure 12).
Figure 12. OCT shows a hyperreflective fibrotic nodular area that corresponds to the fibrotic area and easily detects diffuse or cystoid edema. In the wet form, OCT shows diffuse or cystoid edema involving the RPE detachment.
Time-Domain vs. Spectral-Domain OCT in AMD
Correlation with Other Techniques in AMD
OCT retinal studies in patients with AMD can complement information obtained with other conventional examinations, such as FA, or other more modern techniques such as autofluorescence. We discuss the added value of combining these techniques in recent studies.
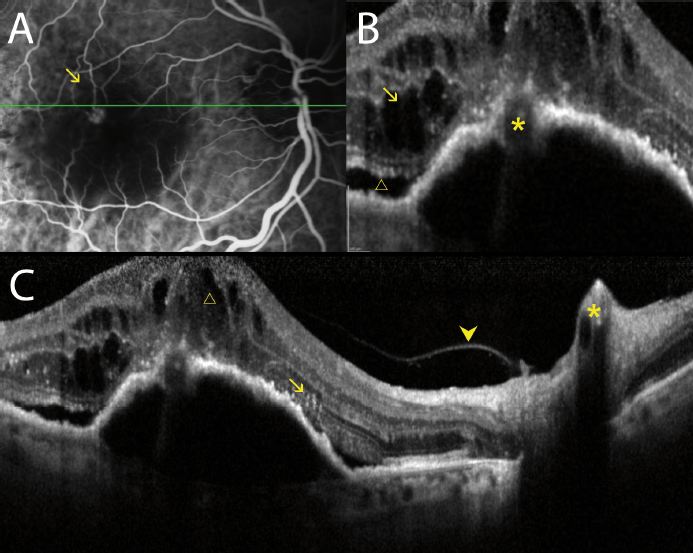
OCT and Fluorescein and Indocyanine Green Angiography
Because of the widespread use of OCT, the use of FA and ICG has decreased considerably in routine consultations, but it is still an essential examination for studying CNV in patients with AMD, especially in the identification of occult CNV. When comparing both techniques, due to the improved definition of the latest OCT devices some studies have reported similar results for both examinations. Krebs and colleagues reported that OCT can detect signs of activity similarly to FA in two different studies directed to evaluate the agreement between two independent graders. The authors highlighted that OCT was slightly more sensitive than FA for determining the activity of the membranes, while other authors stated that it was necessary to manually adjust the segmentation analysis of images to achieve similar results(22,38). More recently, Malamos and colleagues used a high-definition OCT device to analyze patients diagnosed by FA in different types of AMD (early, classic, minimally classic and occult). They reported a significant correlation between different angiographic patterns and various OCT parameters. The authors could discriminate different types of lesions using OCT to the extent that they could identify their precise anatomic location in retinal maps types of AMD (early, neovascular classic, minimally classic, and occult). They reported a significant correlation between different angiographic patterns and various parameters with OCT. The authors could discriminate different types of damage using OCT to the extent that they could identify their precise anatomic retinal maps.(39) In cases with occult membranes and some cases of RAP, the relevance of FA is greater because of the difficulty to delineate the precise location of the pathology in the tomographic images (Figure 14). However, some authors have described qualitative OCT changes associated with CNV membranes, such as the presence of exudation signs and PEDs, and changes within the polymorphic features of these lesions.(3)
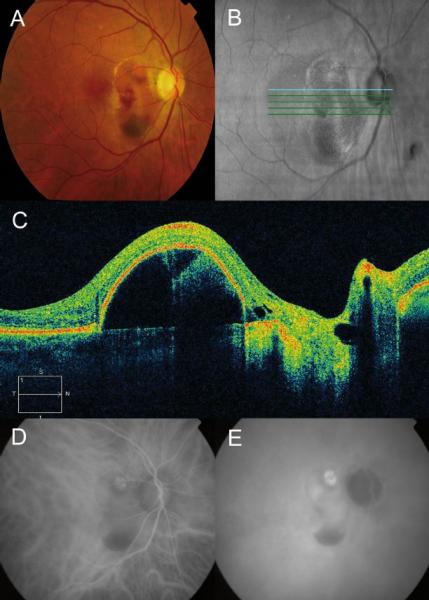
Figure 14. The retinography corresponds to a PCV (A), where you can observe the presence of intraretinal hemorrhages. In the red-free image (B) you can observe the tomographic cut line. The OCT shows a marked elevation of the cup-shaped RPE (C). By ICGA you can observe a hot spot that confirms the diagnosis (D, E).
OCT and Autofluorescence
Autofluorescence allows gathering of information about the metabolic status of the retina. This technique is based on the ability of tissues to emit more or less fluorescence depending on the amount of accumulated lipofuscin after being excited by light at specific wavelengths, providing the opportunity to evaluate the retinal functional status. Since OCT obtains a detailed picture of the retinal anatomy, several studies have evaluated the structure/function in patients with AMD and correlated the two techniques. Brar and colleagues(46) reported that there was a significant association between OCT and autofluorescence findings, and highlighted that increased hyperfluorescence at the edges of the GA plaques correlated with hyperreflective changes in the outer retinal layers identified by OCT, finding that did not occur in healthy retinas with normal autofluorescence and OCT images (Figure 15).
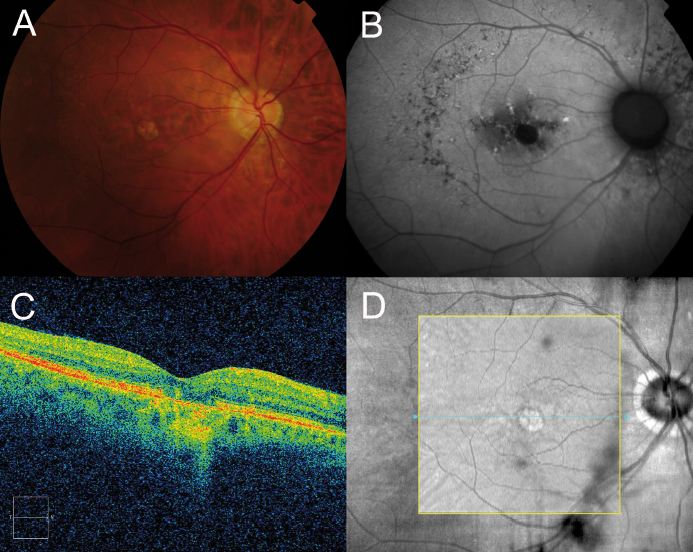
Figure 15. (A) The retinography shows a juxtafoveal atrophic plaque. (B) The autofluorescence image delineates the atrophic plaque as an area of complete absence of fluorescence. (C) The OCT shows an increased choroidal reflectance due to the window effect produced by the overlying atrophic plaque. (D) Infrared image captured by the OCT that shows the tomographic section of figure C.
Therefore, the combination of both techniques allowed the determination of the patterns of progression of GA plaques in patients with AMD.(47)
Clinical and Therapeutic Implications of OCT in AMD
OCT is now a routine examination for patients with AMD. Although some studies have advocated a role for OCT in the dry forms of the disease, its use is greater in patients with the neovascular forms, and it is now the main method employed for lesion monitoring in this condition in routine clinical care. The role of OCT as a reliable tool for assessment of treatment response has been described since the PDT era. In recent years, the development of antiangiogenic therapies have made OCT a fundamental tool in routine patient management, and several landmark studies have based the need for retreatment in OCT.
Dry AMD
The better definition achieved by OCT devices that include SD technology allows a more detailed study of the outer retinal layers and RPE, which are important structures in the development of dry AMD. Thus, new SD-OCT instruments can accurately distinguish the presence and size of drusen and RPE changes, making it possible to differentiate the different retinal layers to identify changes at that level(45) Thus, in a group of patients with dry AMD, Schuman and colleagues(48) found localized thinning of the photoreceptor layer immediately above the drusen compared to healthy controls, suggesting a degenerative process with cell loss to explain the decreased visual function in this group (Figure 16).
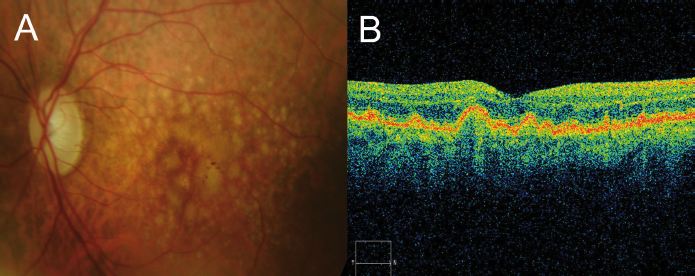
Figure 16. (A) Central soft drusen may be seen in the retinography. (B) Drusen are observed as undulations and elevations of RPE hyperreflective band with less reflective material below them.
Bearelly and colleagues(17) studied the thinning at the edges of the plaques of GA to establish a gradient in the thickness of the photoreceptors layer from the healthy retina to the atrophic plaque. Although they had a small sample size in their study (n = 17), they concluded that SD-OCT allows quantitative measurement of disease progression and postponed for future study the application of the technique. Moreover, to study progression of the dry forms, other studies have been designed to correlate the SD-OCT findings with other techniques such as autofluorescence. To this end, Stopa and colleagues(47) analyzed a series of patients with dry AMD and correlated SD-OCT images of areas of GA, isolated hard drusen and soft coalescing drusen with retinographies and autofluorescence images. Moreover, in addition to different patterns of reflectivity for each type of drusen, they observed that certain patterns of hyperreflectivity in some drusen and the overlying retina corresponded to increased or decreased autofluorescence at these points. This certainly established a morphology-function relationship between the images obtained with both techniques (Figure 17).
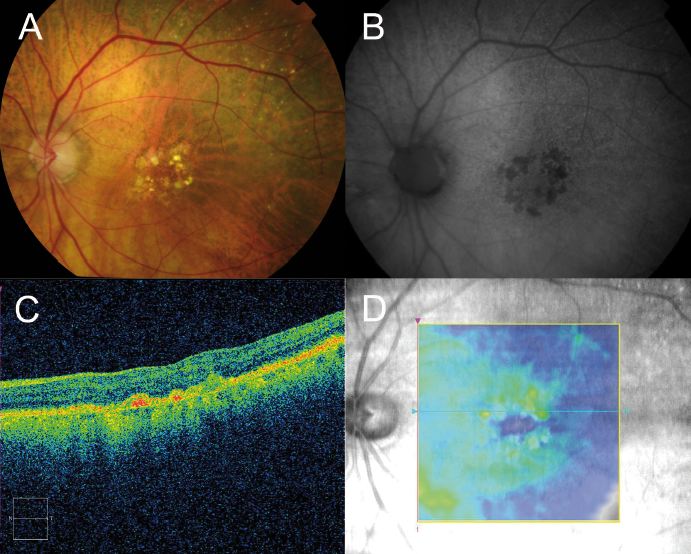
Figure 17. (A) Central hard drusen surrounded by atrophic areas of the RPE are seen in the retinography. (B) In the autofluorescence image, a hypofluorescence area corresponding to atrophic areas of the RPE may be appreciated. (C) In the OCT, two hyperreflectant points corresponding to hard drusen observed in the retinography are seen. (D) Infrared image captured by the OCT which shows the tomographic section line of figure C.
Finally, in some cases Stopa and colleagues identified small hyporeflective spots in retinas with soft coalescent drusen and drusenoid PEDs corresponding to subretinal fluid, which were not found in other examinations. In conclusion, the study of dry AMD need a combined approach with both autofluorescence and OCT in a multimodal imaging approach. Whereas OCT provides anatomic information on retinal structures, autofluorescence gives information of the metabolic status of the retinal tissues and allows accurate delineation of RPE atrophy lesions.(49)
WET AMD
Retinal study using OCT is now a fundamental tool to manage patients with wet AMD. Since the introduction of PDT as an antiangiogenic therapy a decade ago, OCT has been proven a useful tool to provide information about the activity of neovascular membranes, and has determined the need for treatment, the treatment response, and identified the early signs of recurrence or resolution. Several multicenter studies were designed to evaluate treatment protocols with antiangiogenic therapies that rely on OCT as a key tool to guide retreatment, as a way to optimize treatment regimens and decrease the number of injections in these neovascular AMD patients.
The PrONTO study (Prospective Optical Coherence Tomography Imaging of Patients with Neovascular Age-Related Macular Degeneration Treated with intraOcular Ranibizumab): The injection protocols established in multicenter phase III studies of ranibizumab for neovascular AMD, the ANCHOR and MARINA trials, consisted of monthly intravitreal injections for 2 years for all study eyes that resulted in substantial gains in VA in various intermediate controls and at the final examination(50-52) However, the dose of 24 injections carried a human and economic burden unaffordable in routine clinical care. Before these studies, in the phase I and II studies of ranibizumab, an extension study was conducted in which administration of new additional doses were left to the discretion of the investigator based on the presence of diffusion on FA or intraretinal or subretinal fluid on OCT. This subanalysis showed that the presence of retinal fluid could often be detected much earlier by OCT than FA, suggesting a greater role for OCT in the assessment and monitoring of these patients.
Based in this idea, Fung and colleagues at the Bascom Palmer Eye Institute in Miami, Florida, proposed the PrONTO Study. In that study, after three monthly injections (loading dose), monthly retreatments of ranibizumab were administered for 2 years according to the criteria in Table 3 in a PRN basis.
|
Table 3. PrONTO Study (1st year). Criteria for Reinjection after Three Loading Doses
|
|
|
1. Decrease of 5 letters of VA (ETDRS) and fluid on OCT |
|
|
*Corrections for the second year of study: Qualitative changes on OCT images suggestive of recurrent macular fluid, including: intraretinal cysts, subretinal fluid, PEDs. |
Of note, three out of five criteria were based on OCT analysis (VA decreases exceeding five ETDRS letters with fluid in the macula detected by OCT, central retinal thickness increases exceeding 100 microns compared to previous lowest value measured by OCT or fluid recurrence on OCT in a previously dry eye) (Figure 18).(53)
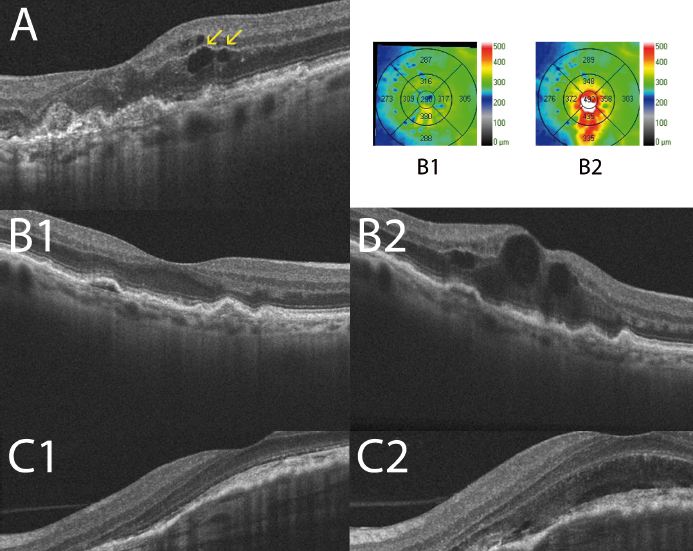
Figure 18. In the PrONTO clinical trial, three criteria of retreatment are based in the analysis by OCT: Decrease of more than 5 letters of VA (ETDRS) with fluid detected in the macula by OCT (A), increase of more than 100 µm in the central retinal thickness respect to the lowest previous value measured by OCT (B1, B2) or fluid reappearance in the OCT in a previous dry lesion (C1, C2).
Interestingly, the VA results of this study were similar to those obtained in the previous phase III trials, but required significantly fewer injections (an average of 5.6 vs. 12 injections during the first year of the study and 9.9 vs. 24 injections to complete the second year).
The good VA results obtained with the lower number of injections based on OCT led to the inclusion of OCT as a primary criteria in new multicenter studies such as the SAILOR or SUSTAIN studies. Those studies included a larger number of patients than in the original PrONTO study (n = 40) and confirmed the important role of OCT in the monitoring of these patients.
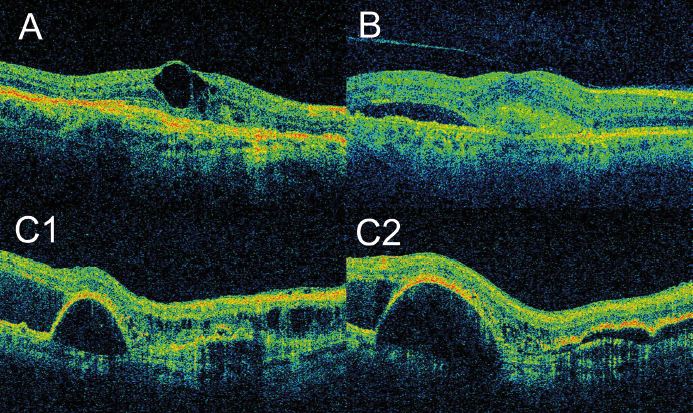
Figure 19. In the second year of the study, the presence of qualitative changes in the OCT images that suggested fluid recurrence was included, such as intraretinal cysts (A), subretinal fluid (B), or progression of a PED (C1 and C2)(54).
OCT and Reviews: “Treat & Extend.”
In patients with wet AMD treated with antiangiogenic drugs, the two more important parameters are the injection frequency and the number of visits. The latter represents a substantial burden for both patients and families, and healthcare system. Several studies (PIER, EXCITE) proposed fixed revisions, but the results were worse than those obtained with monthly revisions, with both fixed reinjection protocols and those based on OCT(55-57). Therefore, it is necessary to establish specific criteria to control AMD and allow more time between retreatments without losing the treatment effectiveness. Once again, OCT had a fundamental role in this approach. In this sense, Spaide proposed a revision scheme called Treat and Extend; after three monthly loading injections, patients were reevaluated in 6 weeks, at which time the physicians determine whether signs of activity by funduscopy and edema or intraretinal or subretinal fluid by OCT are found (Figure 20).(58)
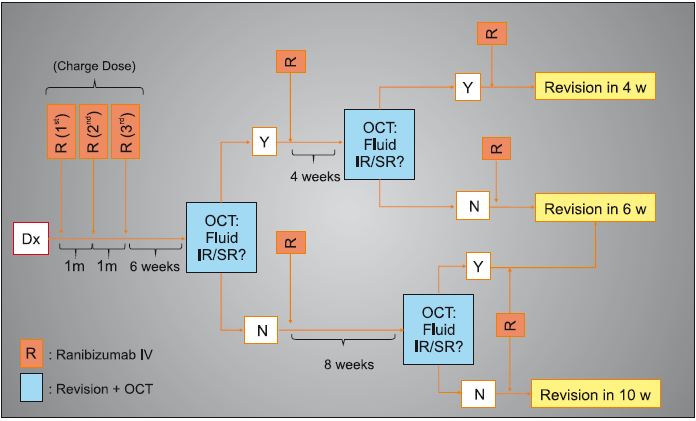
Figure 20. Treatment schedule and revisions of Treat & Extend.
The VA results depend not only on the number of injections but also the frequency of subsequent visits by the protocol presented in this proposal, which again gives OCT a leading role, as it indicates the detection of activity and therefore the frequency of visits. The use of this treatment regimen is being evaluated in a study conducted at Wills Eye Institute, Philadelphia, Pennsylvania. The preliminary results are promising, with a lower frequency of examinations, i.e., an average of 7.4 injections annually and similar VA outcomes to those obtained in the PrONTO study in a greater number of patients (n=92)(59)
Prognostic Factors in OCT
Several OCT parameters are associated with decreased VA and different responses to other antiangiogenic treatments regarding VA, central retinal thickness and prognosis after treatment. Singh and colleagues retrospectively analyzed a group of patients with wet AMD treated with bevacizumab (Avastin, Genentech, south San Francisco, CA) and concluded that in addition to VA pre-treatment, the total retinal thickness measured by OCT affected the final VA and the total decrease in the post-treatment retinal thickness, which was lower in patients who had received previous treatments.(60) Keane and colleagues also found that the main factor associated with decreased VA was the volume of subretinal tissue, and in fewer cases, thickening of the neurosensory retina, without a significant association with the total volume of subretinal fluid and RPE detachment and VA.(22) However, these parameters did not justify the variability found in the VA for similar values of subretinal tissue volume or thickening of the neurosensory retina. The authors pointed to the complex pathophysiology of the CNV membranes and the limitations of the TD-OCT devices employed to explain the results. Sayanagi and colleagues reported that SD-OCT is a superior generation of TD-OCT than its predecessors for assessing the activity of the neovascular membranes and changes in AMD after ranibizumab treatment, and Kiss and colleagues pointed to the RPE status of neovascular membranes as main predictor of VA in patients treated with ranibizumab in addition to conventional parameters (i.e. central retinal thickness).(37-61) Several studies also reported a significant correlation between a hyperreflective band indicating the integrity of the junction between the inner and outer segments of the photoreceptors and higher VA in patients treated with ranibizumab.(62-63) It appears that parallel to the development of new devices, structures assume special importance, such as the junction of the inner and outer segments of the photoreceptors, which until now was only identified, as shown by studies with ultrahigh resolution OCT (UHR-OCT) prototypes with a high-definition axial resolution of 3.5 microns.(64-65) Lee and colleagues reported that the presence of posterior vitreomacular adhesion on OCT was associated with CNV in a large series of patients with AMD (n = 251). Those authors suggested that this finding is a possible risk factor for subretinal membrane development because of chronic vitreomacular traction on the retina, opening the door to a possible surgical approach in patients not responding or resistant to drug treatment (Figure 21).(66-67)
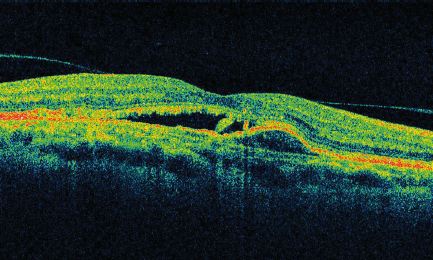
Figure 21. The chronic retinal vitreomacular traction has been considered as a possible risk factor for development of subretinal membranes. In the image, a subretinal membrane associated with a vitreomacular traction in the presence of a PED and subretinal fluid may be appreciated.
Ahlers and colleagues at the Medical University of Vienna pointed to a new parameter as a prognostic factor in patients with AMD, the optical density ratio of the subretinal fluid detected by OCT(68). The authors suggested that this ratio may be an indirect way to measure the integrity of the blood-retinal barrier and, therefore, be useful in the differential diagnosis of different exudative macular diseases, such as central serous chorioretinopathy, as well as to assess the response to antiangiogenic drugs (Table 4).
|
Table 4. Prognosis Factors According to OCT as Identified by Various Authors.
|
|
|
Parameter |
Author and year |
|
Total retinal thickness
|
Singh 2009
|
|
Subretinal tissue volume
Neurosensory retina thickening |
Keane 2008
|
|
RPE status
|
Kiss 2009
|
|
Integrity of the union of outer and inner segments of photoreceptors |
Sayanagi 2009, Kaluzny 2009, Chen 2009, Witkins 2009 |
|
Posterior vitreomacular adhesion |
Lee 2009, Mojana 2008 |
|
Optical density ratio |
Ahlers 2009 |
OCT and Wet AMD in Clinical Practice
To reach a consensus on the criteria of treatment and frequency of revisions, daily management of these patients is individualized, and the decisions are based on clinical examination and qualitative analysis of OCT images(2). The main signs of CNV activity in OCT are the presence of intraretinal or subretinal fluid, PEDs and/or RPE rips. These OCT findings should be evaluated biomicroscopically for the presence of fibrosis in disciform scars, which are final and irreversible stages of the disease that sometimes can be shown on OCT. The presence of any of these tomographic signs, the patient’s VA, and the ophthalmoscopic and angiographic appearance of the lesions should be evaluated by ophthalmologists to reach treatment decisions and the frequency of follow up visits in each individual case. It is also important to identify other OCT signs that may be confounded with signs of CNV activity, such as retinal tubulations and viteliform detachments, that do not represent actual exudation of fluid in the subretinal space (Figures 22-26).
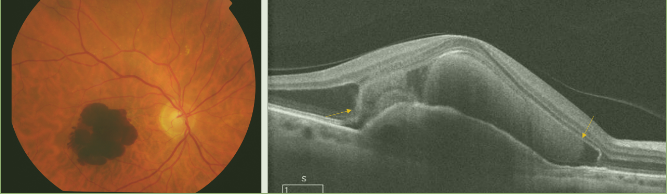
Figure 22. Massive subretinal hemorrhage secondary to wet AMD. Blood (yellow arrows) is collected between the RPE detachment and the neurosensory retina.
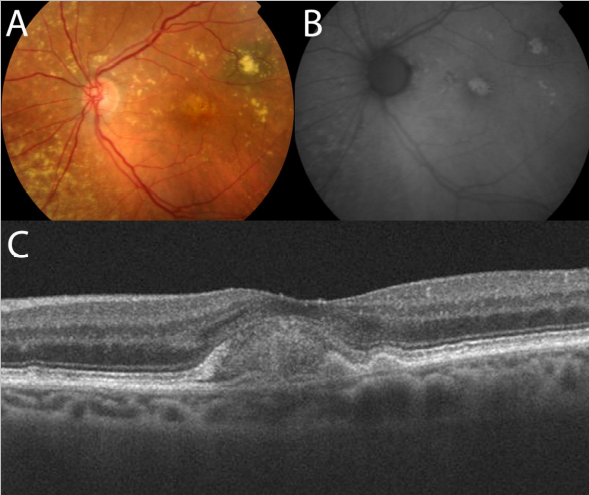
Figure 23. Adult-onset foveomacular vitelliform lesion in a patient with drusen (A); multiple hyperautofluorescent material deposits are seen (B). OCT shows the material over the RPE (C) that must not be confounded with a neovascular membrane related to wet AMD.
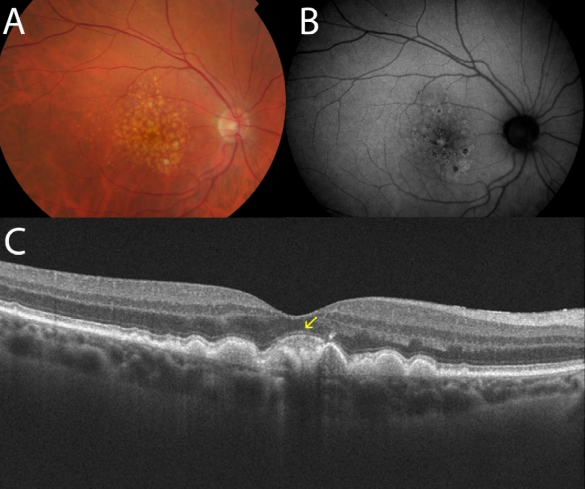
Figure 24. Adult-onset foveomacular vitelliform lesion in a patient with drusen (A); multiple hyperautofluorescent deposits are seen (B) together to hypoautofluorescent RPE atrophy. OCT shows the material over the soft drusen (yellow arrow) (C) that must not be confounded with a neovascular membrane related to wet AMD.
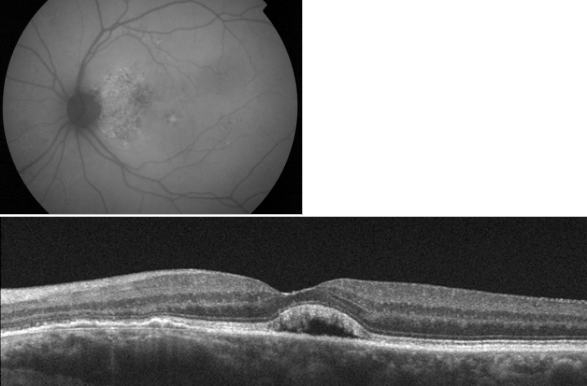
Figure 25. Adult-onset foveomacular vitelliform lesion with hyperautofluorescent central deposit. OCT shows a vitelliform detachment due to reabsorption of the vitelliform material that must not be confounded with subretinal fluid related to wet AMD.
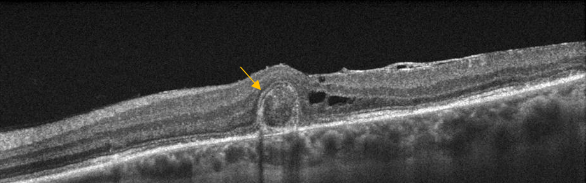
Figure 26. Outer retinal tubulation (yellow arrow) in cross-sectional SD-OCT. They must not be confounded with subretinal fluid in wet AMD.
New Techniques and Prototypes in AMD
OCT and Confocal Scanning Laser Ophthalmoscopy
Some new SD-OCT instruments (Spectralis HRA-OCT, Heidelberg Engineering, Inc., Heidelberg, Germany; Spectral OCT/SLO, Opko/OTI, Inc., Miami, FL) are equipped with this method, which simultaneously captures digital funduscopic images (infrared, red free autofluorescence, FA and ICGA) and OCT images from the same light source. This enables clinicians to correlate the two images pixel by pixel and allows a detailed topographic survey and tomographic retinal structures.(69) In AMD, these devices are used especially in studies attempting to correlate OCT and autofluorescence in GA.(70-71)
Displaying the Choroid with Depth-Enhanced Optical Imaging OCT
The principle of OCT requires penetration of the emitted laser beam through the retinal and choroidal structures before being received for analysis. Thus, with the standard technique, images of the full-thickness retina to the RPE, Bruch’s membrane and choroid immediately adjacent space can be obtained, but the remainder of the choroid is beyond the capabilities of the instrument. To study this layer, Spaide developed a system in which the focus of the retinal scan is displaced to the choroid in a way that multiple inverted images are processed to obtain a higher quality image in which the choroid can be seen in greater depth. Several diseases have been studied using this technique. This technique may be relevant for studying wet AMD associated with RPE detachment and especially in occult CNV, which often cannot be visualized with conventional OCT. (40,42,72-74)
New Prototypes: High-Speed Resolution Ultrahigh OCT
Spectral Domain (SD) instruments reach axial resolutions of 5 microns, using a laser source that emits light at a certain wavelength and a detection system based on the Fourier principle. To obtain even higher resolutions, several groups have designed devices that modify these components, mainly the light source. A group at Tufts Medical Center, Boston, developed a prototype that uses a superluminescent diode broadband laser combined with a Fourier detection system that can achieve axial resolutions up to 3.5 microns, allowing precise delineation and analysis of the outer retinal layers, such as the photoreceptors layer, the RPE and Bruch’s membrane(75). The investigators have published several studies highlighting the importance of these stratus in the pathogenesis of dry AMD, the ability for early detection of intraretinal and subretinal fluid and the status of the photoreceptors before and after ranibizumab treatment in a series of patients with wet AMD.(4,65,76,77)
En-Face OCT Imaging
En-face OCT is one of the OCT visualization approaches that has significantly benefited from technical advancements in OCT technology(78). En-face software reconstruct images on the coronal plane, from the scans obtained using a dense raster scan cube of the posterior pole. En-face OCT produces transverse images of retinal and choroidal layers at any specified depth, which offers additional benefit on top of longitudinal cross-sections. This technology is very useful for diagnosing and monitoring diseases with layer-specific anatomic abnormalities (Figures 27-29). It also has the ability to localize OCT images in other fundus imaging modalities, using retinal vessels as landmarks.
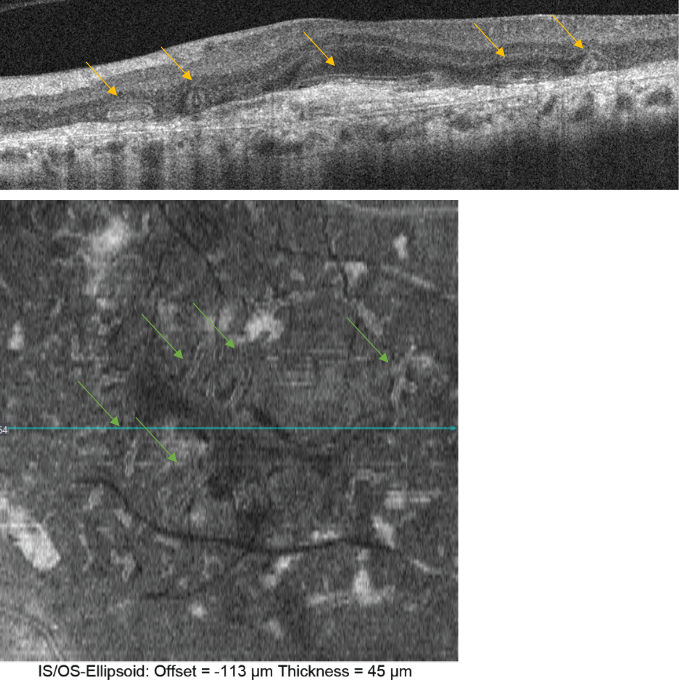
Figure 27. Outer retinal tubulation (yellow arrows) in cross-sectional (upside) and en-face SD-OCT (downside, green arrows). Tubulations are hyporeflective areas representing a lumen surrounded by a hyperreflective border consisting of cone photoreceptor mitochondria and external limiting membrane, indicating that cones have lost their normal directionality due to loss of outer segments and subsequent retinal remodelling. They must not be confounded with subretinal fluid in wet AMD.
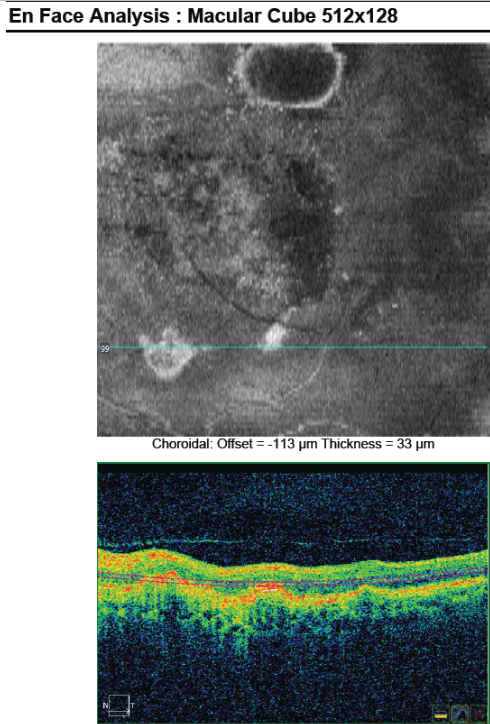
Figure 28. En-face OCT imaging: dome of the PED appears as hyporeflective area, predominantly circular with marked and well-defined hyperreflective margin. Polyps appears as round multiple heterogeneous hyperreflective structures.
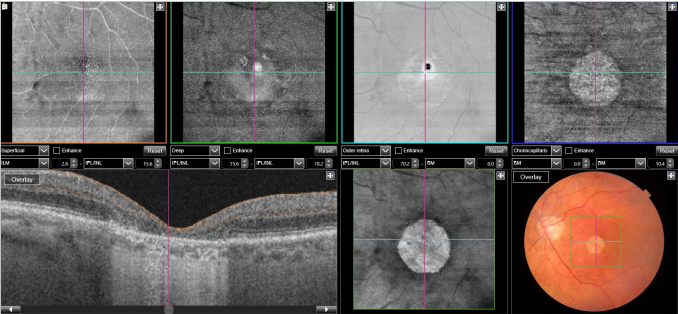
Figure 29. SS-OCT and en-face OCT of a patients with late AMD with geography atrophy. En-face OCT is a reliable method to detect and quantify GA, particularly when analyzed at the outer retina and choriocapillaris level, where the photoreceptors' loss creates an abrupt transition in OCT reflectivity.
SS-OCT
Swept-source (SS) OCT utilizes a longer wavelength of 1060 nm, that increases depth penetration, thus improving penetration and enhanced resolution of the deeper layers of the eye, including the choroid and sclera(86). Furthermore, it is capable of faster scanning rates, allowing for image capture, doubling the scan acquisition speed of SD-OCT devices. SS-OCT has acquisition rates of up to 100,000–236,000 A-scans per second and a resolution of up to 11 μm, thus permitting to obtain widefield B-scans (12 mm vs 6–9 mm with conventional SD-OCT) and more accurate 3-D imaging of the vitreous, retina and choroid (Figures 30-39).
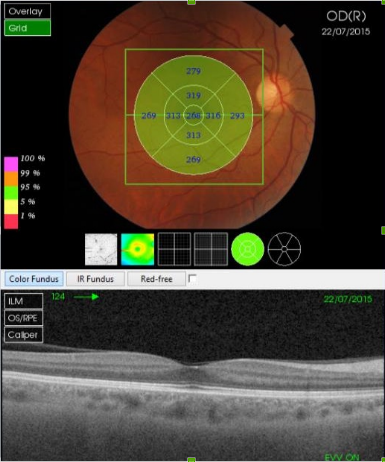
Figure 30. SS-OCT of a normal eye combined with color photography. Vitreoretinal interface with vitreous adhesions and choroid are clearly identified.
Figure 31. SS-OCT of soft drusen.
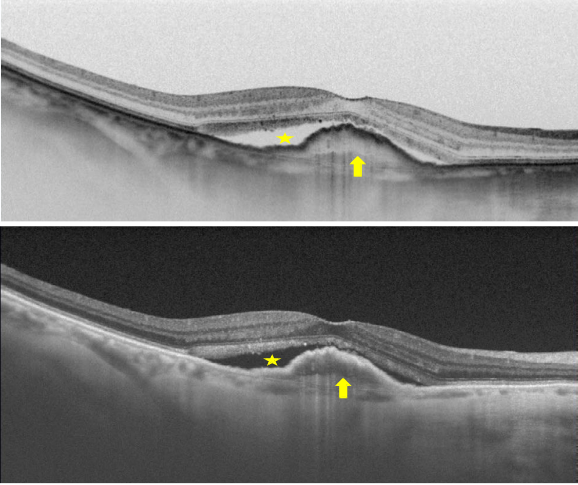
Figure 32. SS-OCT of wet AMD with subretinal fluid (yellow star) and RPE detachment (yellow arrow). Top, inverted image.

Figure 33. SS-OCT of a normal eye combined with autofluorescence. Vitreoretinal interface with vitreous adhesions and choroid are clearly identified. Retinal thickness graph after automatic measurement is also visualized.
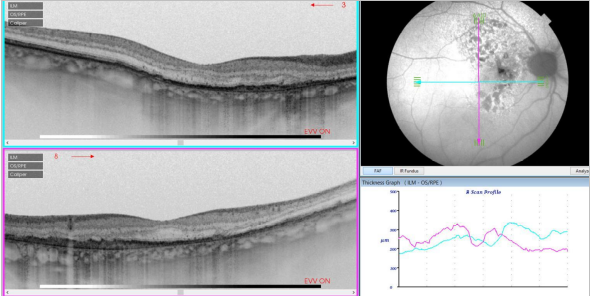
Figure 34. SS-OCT of an eye with intermediate AMD with drusen and retinal pigment abnormalities combined with red-free fundus photography. Retinal thickness graph after automatic measurement is also visualized.
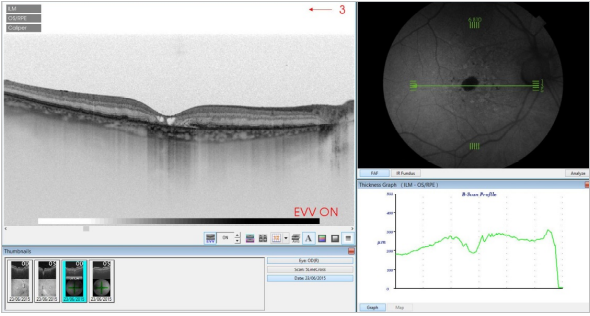
Figure 35. SS-OCT of an eye with late AMD with GA and retinal pigment abnormalities combined with autofluorescence fundus photography. Intraretinal cysts may be sometimes observed in areas of GA in absence of CNV.
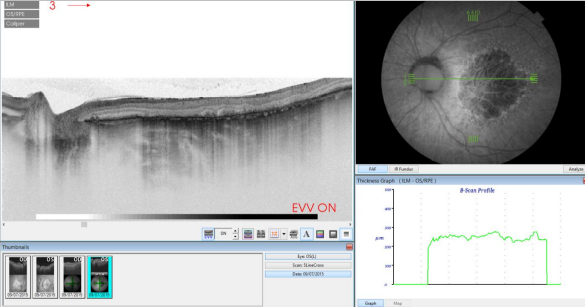
Figure 36. SS-OCT of an eye with late AMD with GA combined with autofluorescence fundus photography. Increased transmission in the area of atrophy and reduced choroidal thickness.
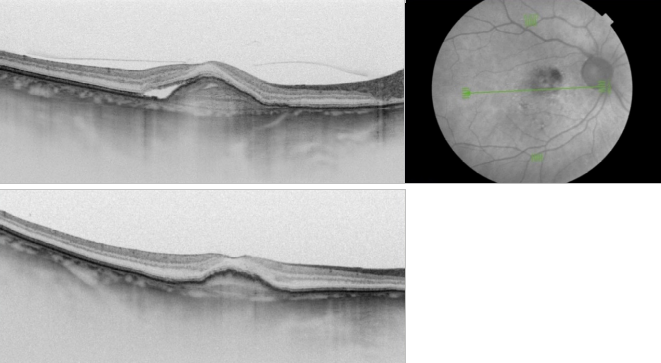
Figure 37. SS-OCT of an eye with late wet AMD with subretinal fluid and RPE detachment in a case of active CNV (top) and after intravitreal anti-VEGF injection with disappearance of the subretinal fluid (bottom).
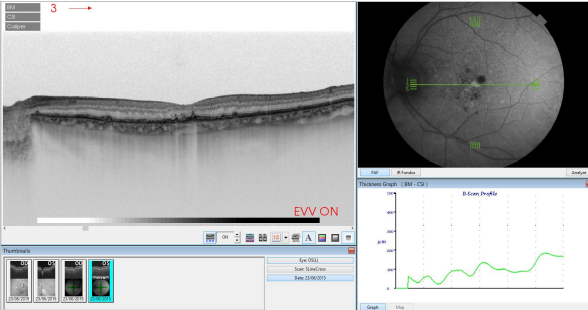
Figure 38. SS-OCT of an eye with AMD with drusen and retinal pigment areas of atrophy.
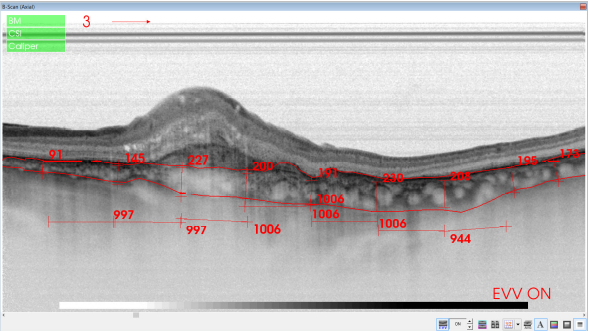
Figure 39. SS-OCT of an eye with late wet AMD with manual measurement of the choroidal thickness, measured each 1000 microns (bottom, horizontal numbers).
ANGIO OCT (OCTA)
En-face OCT is a valuable imaging strategy for anatomic and angiographic viewing of the fundus. Their use combined with Doppler OCT, that utilizes ultra-high-speed image acquisition using blood flow as a contrast medium, to evaluate retinal and choroidal vasculature has result in the development of optical coherence angiography (OCTA)(92). OCTA is a non-invasive technique, based on Doppler shift induced by red blood cell flow, to visualize vessels with active flow. The three-dimensional reconstruction of vascular mapping at the microcirculation vascular flow highlights the potential of this technology to identify important vascular changes in different retinal and choroidal diseases including CNV and GA(93,94), and it is a very promising technique to replace more invasive imaging techniques such as FA and ICGA.
However, image artefacts occur frequently in OCTA images, and these artefacts are more frequent in eyes with pathology(95). It is possible that SS-OCTA is able to better delineate the full extent of CNV vasculature, and yielded significantly larger CNV areas than SD-OCTA(96). Moreover, it should be noted that OCTA is able to detect asymptomatic neovascularization in eyes with intermediate AMD, lesions that are visible only as plaques in ICGA(97).
Figures 40 to 53 show several cases of OCTA exams of a normal eye and of diseased eyes in different stages of AMD.
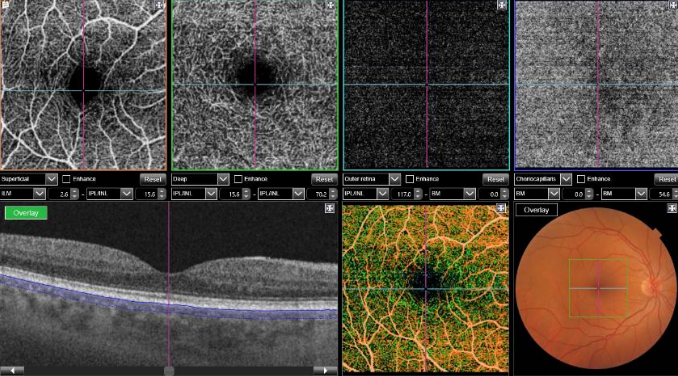
Figure 40. OCTA of a normal eye. From left to right, superficial retinal vascular plexus, deep retinal vascular plexus, outer avascular retina and choriocapillaris, combined with SS-OCT, color representation of all the combined vascular zones and retinal color photography.
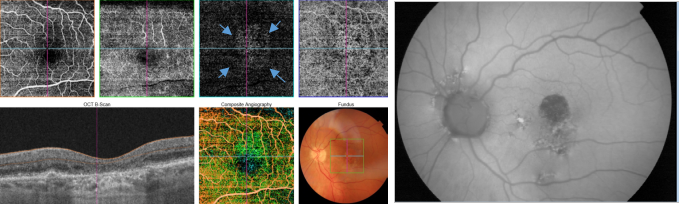
Figure 41. OCTA of an eye with late AMD with GA. An artefact simulating a CNV (blue arrows) is observed in the outer retina and choriocapillaris over the area of atrophy.
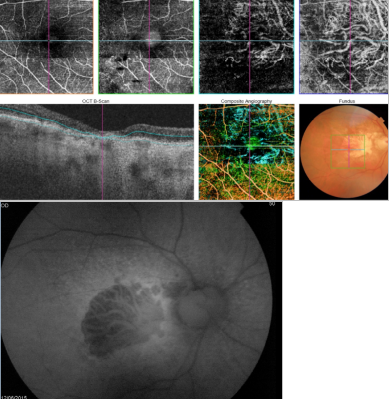
Figure 42. OCTA of an eye with late AMD with GA. An artefact simulating a CNV is observed in the outer retina and choriocapillaris over the area of atrophy.
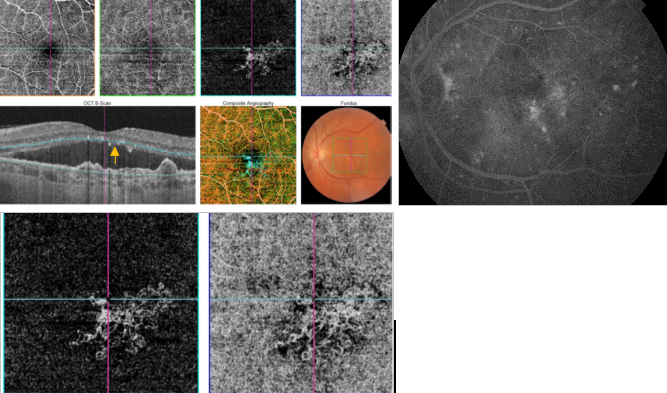
Figure 43. OCTA of an eye with late AMD with type 1 CNV. SS-OCT shows subretinal fluid and drusen. Hyperreflective spots in the neurosensory retina and subretinal fluid are suspected to be inflammatory cells (yellow arrow). CNV vascular network is clearly observed in the outer retina and choriocapillaris of the OCTA.
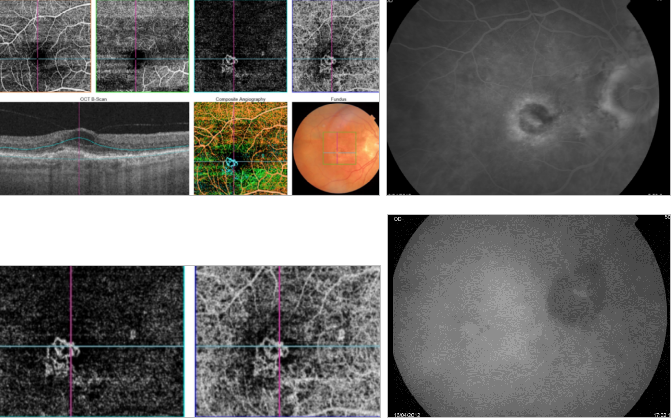
Figure 44. OCTA of an eye with late AMD with type 2 CNV. SS-OCT shows intraretinal fluid and some subretinal fluid over a small RPE detachment. Vitreoretinal traction is also observed. CNV vascular network is clearly observed in the outer retina and choriocapillaris of the OCTA. The neovascular membrane appears as a medusa-shaped complex or a glomerulus-shaped lesion. The external borders of the lesion appear as a dark ring.
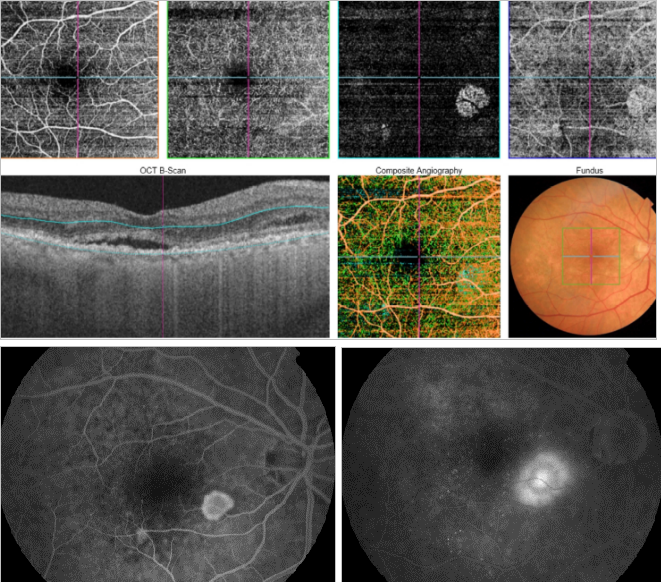
Figure 45. OCTA of an eye with late AMD with type 2 CNV. SS-OCT shows subretinal fluid. CNV vascular network is clearly observed in the outer retina and choriocapillaris of the OCTA. The neovascular membrane appears as a medusa-shaped complex or a glomerulus-shaped lesion.
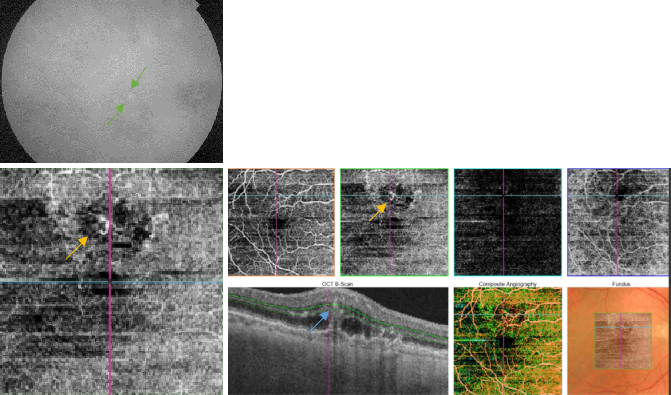
Figure 46. OCTA of an eye with late AMD with type 3 CNV. SS-OCT shows subretinal fluid with the presence of an intraretinal-subretinal continuous hyperreflective lesion (blue arrow). Small intraretinal neovascularization vascular network is observed in the deep retina plexus of the OCTA (yellow arrow). ICGA shows the hot spot corresponding to the RAP (green arrow).
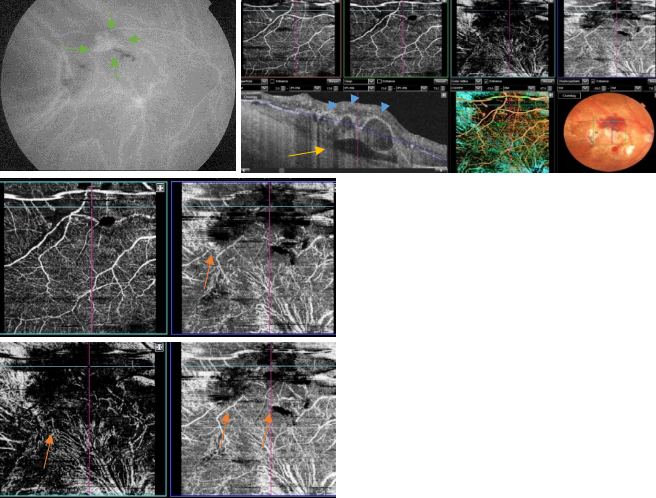
Figure 47. OCTA of an eye with late AMD with PCV. SS-OCT shows a steeply-sloped dome-shaped PED in PCV. A hyporeflective space (cleft) between hyperreflective materials in PED and Bruch's membrane sometimes appears in neovascular AMD. This cleft may represent a space that results from fluid accumulation that originates from active CNV components in the materials in PED (yellow arrow). ICGA shows the hot spot corresponding to the PCV (green arrows). Branching vascular networks showed more clearly on OCTA than on ICGA. Polypoidal lesions had variable patterns on OCTA and were not always detected. The hypo-flow round appearance of the polyps on OCTA (orange arrows) is probably due to unusual blood flow inside of the polypoidal lesions, in contrast with the branching vascular network.
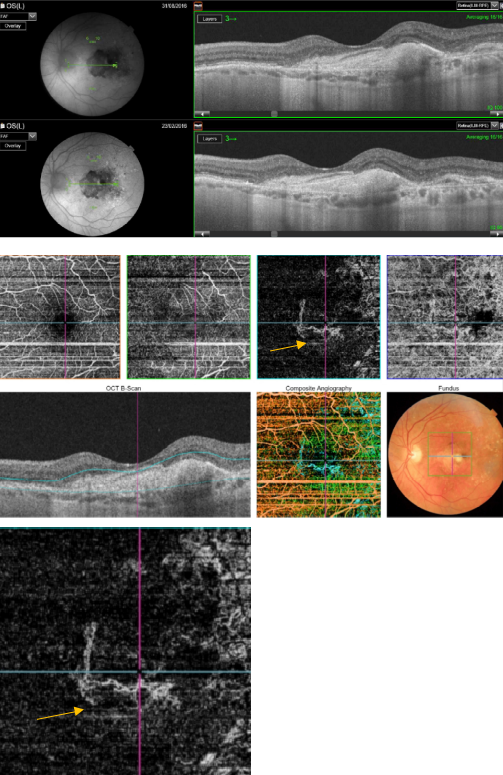
Figure 48. OCTA of an eye with late AMD with disciform lesion. SS-OCT shows no subretinal fluid with the presence of a subretinal hyperreflective fibrous scar. A dead tree image of an inactive neovasvascular network is observed in the OCTA (yellow arrow).
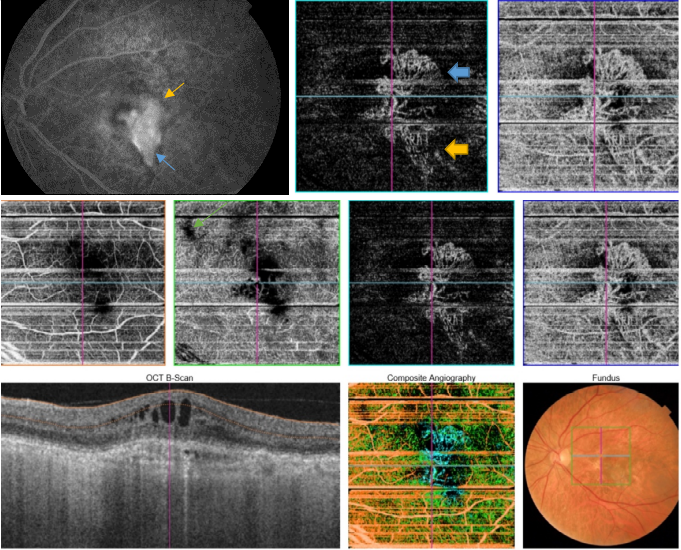
Figure 49. FA is the gold standard for determining the presence of leakage (yellow arrow) or stain of the lesion (blue arrow). SS-OCT shows fluid accumulation (green arrow). Different CNV patterns are identified on OCTA even in the same patient. A lesion was assessed as active (Pattern I, large blue arrow), if it showed at least three of the following five features: 1) shape, a well-defined (lacy-wheel or sea-fan shaped) CNV lesion in contrast to one with long filamentous linear vessels; 2) branching, numerous tiny capillaries, typical of a recent lesion, in contrast to rare large mature vessels, typical of a mature one; 3) the presence of anastomoses and loops; 4) morphology of the vessel termini, assessing the presence of a peripheral arcade in contrast to a “dead tree” appearance (inactive, large yellow arrow); 5) presence of a perilesional hypointense halo, considered as regions of choriocapillaris alteration, either corresponding to flow impairment, steal or localized atrophy. A CNV lesion was considered as Pattern II if it showed less than three of the previously reported OCTA features(98). Horizontal lines are artefacts.
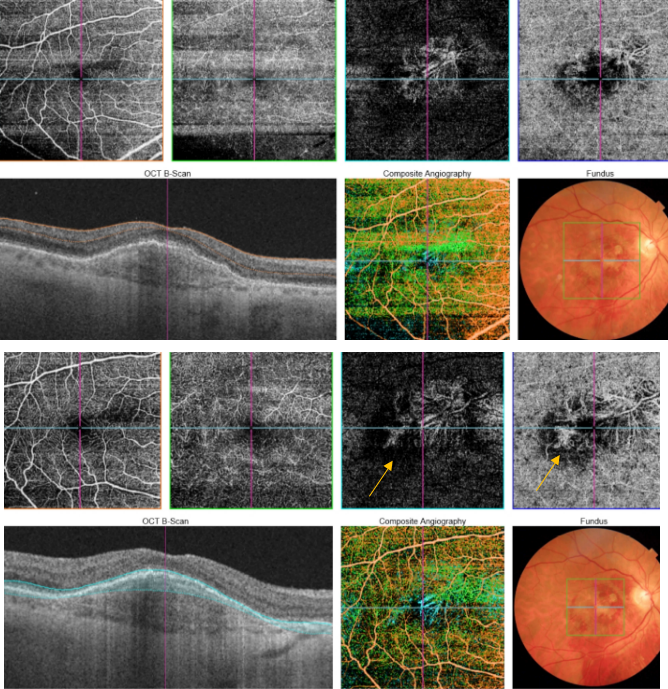
Figure 50. SS-OCT showed no signs of active CNV without intraretinal or subretinal fluid over the RPE detachment. OCTA revealed the presence of a type 1 CNV. After each injection a pruning of smaller vessels is seen immediately that increases for one or two weeks when it reaches a maximum. Bottom, a reopening or new sprouting of the vessels one month later was observed still without the recurrence of the subretinal fluid (yellow arrows).
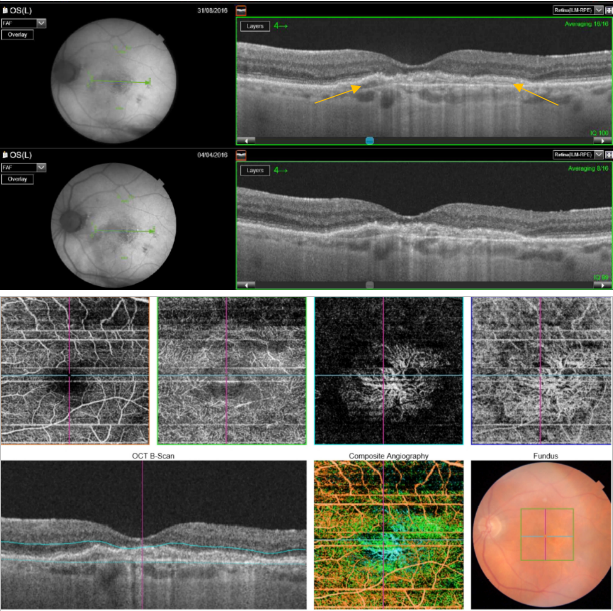
Figure 51. SS-OCT showed no signs of CNV and no intraretinal or subretinal fluid over the RPE changes that are clearly visible (yellow arrows). OCTA revealed the presence of a quiescent type 1 CNV.
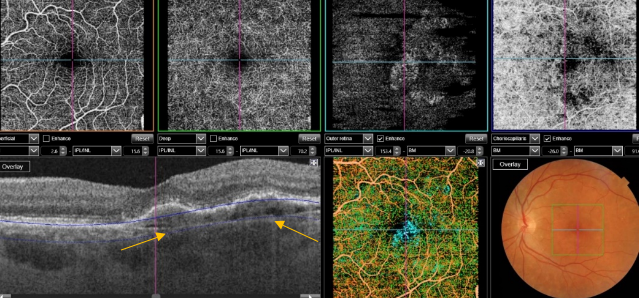
Figure 52. SS-OCT showed no signs of CNV and no intraretinal or subretinal fluid over the RPE changes that are clearly visible (yellow arrows). OCTA revealed the presence of a quiescent type 1 CNV.
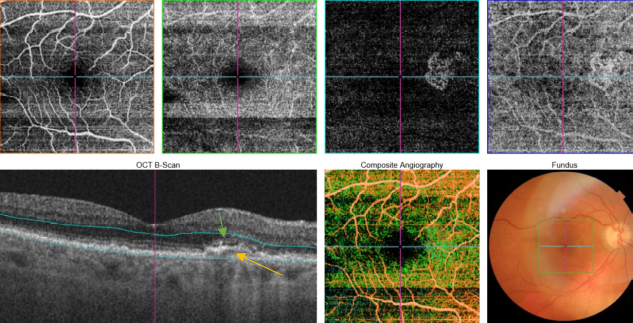
Figure 53. SS-OCT showed subtle subretinal fluid (green arrow) over the RPE changes (yellow arrow). OCTA revealed the presence of a quiescent type 1 CNV.