Fundus autofluorescence patterns and optical coherence tomography in geographic atrophy secondary to AMD
Fundus autofluorescence patterns and optical coherence tomography in geographic atrophy secondary to AMD
Authors:
Jordi Monés, MD
Institut de la Màcula i de la Retina, Centro Médico Teknon, Barcelona. Spain
Marc Biarnés, OD, MPH
Institut de la Màcula i de la Retina, Centro Médico Teknon, Barcelona. Spain
Introduction
Geographic atrophy (GA) and choroidal neovascularization (CNV) represent the advanced forms of age-related macular degeneration (AMD).
GA is defined as a well circumscribed area of atrophy of the retinal pigment epithelium (RPE) where the large choroidal vessels can be seen by ophthalmoscopy and show thinning or absence of the RPE, closure of the choriocapillaris and degeneration of the overlying photoreceptors(1,2).
Visual loss in GA is due to areas of atrophy of the RPE larger than 175 µm and subsequent loss of tissue in the outer retina (photoreceptors) and choriocapillaris; these areas tend to coalesce progressively and may not affect the fovea until late in the course of the disease (the so-called “foveal sparing”), when visual acuity (VA) finally ensues.
Due to the large paracentral areas of atrophy but preservation of the fovea visual function is often very poor in spite of an apparently good VA.
Patients with a VA of 20/20 may be functionally blind (Figure 1).
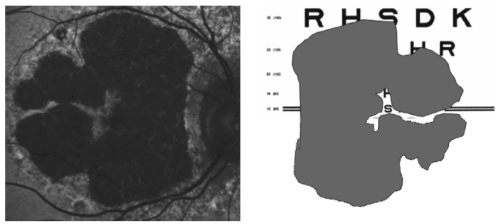
Figure 1 - Foveal sparing may allow a 20/20 visual acuity in spite of very severe visual function impairment
Relatives of the patients, and even ophthalmologist, have often confused VA for visual function, thus, frequently these patients have felt poorly understood(1).
GA is responsible for one-third of the cases of end stage disease(3) and accounts for 20% of cases of severe visual loss due to the disorder(4).
At the age of 85 years or older incidence of GA is four times the one of CNV. GA is not a benign disease; the atrophy of the external layers may progress at a speed of 1.5-2.6 mm² per year
(Figure 2)(5).
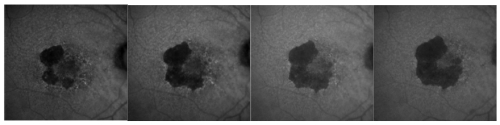
Figure 2 - GA atrophy progression in one year of the right eye of the same patient (fundus autofluorescence images).
It remains a significant challenge because of its potential to cause blindness, its relentless progression and the lack of current effective treatment.
With the progressive increase of the longevity in developed countries GA secondary to AMD represents a true epidemic. Recent research has pointed towards lipofuscin, a fluorophore that accumulates in the RPE, as a triggering agent in the development of atrophy.
Lipofuscin derives mainly from phagocytosed photoreceptor outer segments and accumulates in RPE lysosomes, where one of its many compounds, A2E (N-retinylidene-N-retinylethanol-amine), increases the pH by inhibition of ATPase proton pump function, difficulting its phagocitation and inducing cellular apoptosis(6,7).
Using a fundus spectrophotometer, Delori et al.(8,9) were able to visualize lipofuscin due to its autofluorescent properties (when stimulated with blue light in the range of 488 nm, lipofuscin emits a yellow fluorescence).
Current developments allow the clinical in vivo visualization of the distribution of lipofuscin by means of confocal scanning laser ophthalmoscope (cSLO) or specific filters in the fundus cameras. by macular pigment, lutein and zeaxanthin.
A relatively high degree of inter-individual variability and technical difficulties limit the use of the absolute quantification of pixel gray values for longitudinal or transversal studies, and therefore the interpretation of the images is based on qualitative observations, ie decreased (dark), normal or increased (white) FAF, in a similar way to that of conventional fluorescein angiography.
Fundus autofluorescence
Fundus autofluorescence (FAF) is a novel, non-invasive method for imaging the fluorescence properties of lipofuscin (and possibly other molecules with a range of absorption and emission spectra close to that of this fluorophore) at the level of the RPE.
Using a commercially available cSLO, the distribution of FAF in the normal eye can be seen in Figure 3. It is characterized by a uniform grayish signal in the fundus and a marked dark appearance in the optic nerve (absence of RPE) and retinal vessels (absorption of fluorescence by hemoglobin and other blood contents).
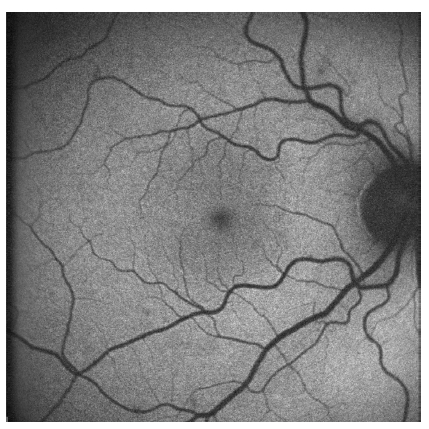
Figure 3 - Normal fundus autofluorescence: uniform grayish signal in the fundus and a marked dark appearance in the optic nerve (absence of RPE) and retinal vessels (absorption of fluorescence by hemoglobin and other blood contents)
The macular area shows progressive diminished signal intensity towards the fovea because of absorption phenomena of short wavelengths A decreased signal is commonly due to RPE atrophy (absence of lipofuscin), an increase in RPE melanin content and absorption from extracellular material anterior to the RPE (intraretinal fluid, fibrosis and media opacities, being cataract a common cause of decreased FAF intensity and poor image quality, specially with cSLO).
On the other hand, an increased signal may be due to lipofuscin accumulation in the RPE (which is the main fluorophore in FAF imaging), presence of other fluorophores not in the RPE (drusen -including those in the optic nerve head-, older hemorrhages), lack of absorbing material and artifacts(10).
FAF imaging in patients with GA is characterized by a decreased signal with sharp borders corresponding to the area of atrophy on conventional retinography (Figure 4).
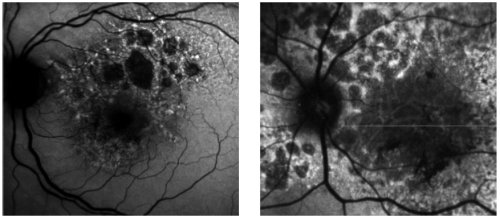
Figure 4 - Fundus autofluorecence of patients with GA secondary to dry AMD.
Atrophic areas show hipoautofluorescence. Borders of the lesion show hyperautofluorescence due to the accumulation of lipofuscin
However, many patients show increased FAF at the borders of atrophy (Figure 5), which has been histopathologically confirmed as areas of increased lipofuscin-filled RPE cells between atrophic and normal retina.
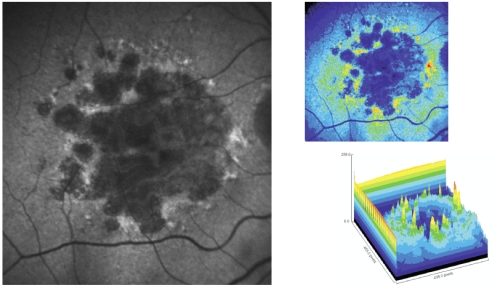
Figure 5 - Surrounding areas of accumulation of lipofuscin at the junction area show increased autofluorescence.
In pseudocolor 3D areas of higher accumulation of lipofuscin are seen as yellow spikes
This finding has not been identified by any other imaging modality.
Holz et al. showed in a longitudinal study that atrophy developed selectively in the junction areas of increased FAF(11) but not elsewhere, a finding that could not be confirmed on a small sample by Hwang et al.(12).
Based on this information, the FAM (Fundus autofluorescence in age-related macular degeneration) study initially described 8 patterns of FAF in the junction zone of GA(13), which were later modified to incorporate a nineth pattern (Figure 6)(14).
”Reproduced with permission from Rightslink (Elsevier)”.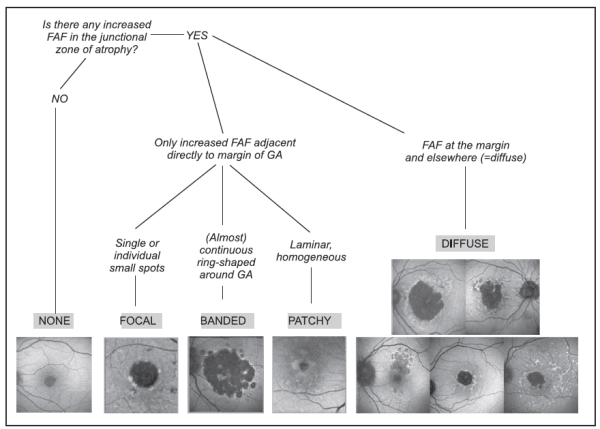
Figure 6 - FAM-Study classification of fundus autofluorescence patterns of geographic atrophy in age-related macular degeneration(14).
According to FAF in the junction zone of atrophy, eyes are classified as none (when there is no increased FAF at the borders of the GA), localized (focal, banded, patchy) and diffuse (fine granular, branching, trickling, reticular and fine granular with punctuated spots)(14).
The relevance of these patterns relays in the fact that they may represent different phenotypic manifestations of the disease.
It has been shown in natural history studies that rates of growth differ between subtypes of FAF and that a strong correlation exists between FAF pattern and progression of atrophy in GA(14,15).
In the FAM study(14) 195 eyes of 129 patients with GA were followed a median of 1.80 years and classified according to FAF pattern at baseline.
Those without abnormal FAF at the borders of the lesion experienced the slowest progression over time (0.38 mm2 /year, n = 17) compared to those with the focal (0.81 mm2 / year, n = 14) and diffuse (1.77 mm2 / year, n = 112) subtype (p<0.0001).
FAF was more strongly associated with GA growth than other classic risk factors, such as size of baseline atrophy, smoking, age or family history.
Nowadays current devices of autofluorescence equipped with semiautomated software allow quantification of total area of GA and measurement of its progression in time (Figure 7).
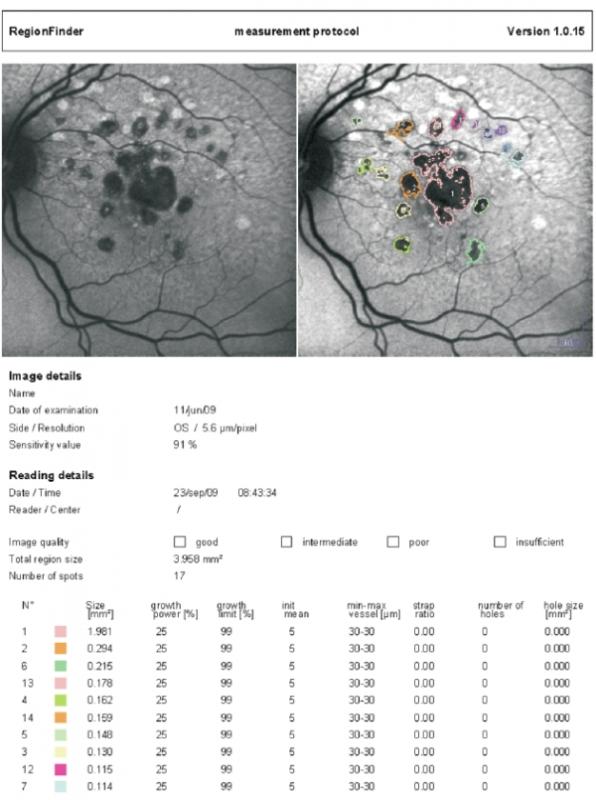
Figure 7 - Semiautomated software allows quantification of total area of GA and measurement of its progression in time (Spectralis Heidelberg Retinal Angiograph/OCT; Heidelberg Engineering, Heidelberg, Germany)
Furthermore, studies using fine-matrix mapping(17) and SLO microperimetry(18) have found impaired rod photoreceptor function and photopic sensitivity respectively in areas of increased FAF in the junction zone, which underscores abnormalities associated with increased fundus autofluorescence.
Taken together, these results suggest that presence of increased FAF at the borders of GA is associated with a greater rate of progression of atrophy and that different patterns of FAF may reflect differences at the cellular and molecular level that may explain the different evolution of the disease process.
This information is relevant for understanding its physiopathology, natural history and to evaluate future therapeutic strategies.
Optical coherence tomography
Recent development of high resolution, high speed spectral domain optical coherence tomography (SD OCT) improves the visualization of the RPE, outer and inner segment of the photoreceptors and external limiting membrane over previous time-domain based technology.
Given the aforementioned reasons, simultaneous imaging techniques that combine SD-OCT and FAF are highly desirable for the evaluation of the atrophic and junction areas of patients with GA (Figure 8).
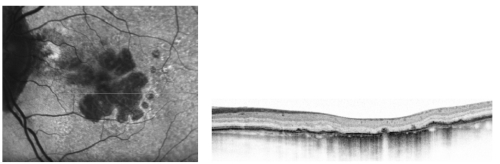
Figure 8 - High resolution optical coherence tomography correlated with the autofluorescence image.
Currently there are instruments that fulfill these criteria and allow the study of the correlation between areas of increased or decreased autofluorescence with the morphologic changes detected in the external retina by SD OCT.
SD OCT in atrophic areas of patients with GA show retinal thinning due to atrophy of the RPE and disappearance of the external retina, that includes inner and outer segment of the photoreceptors and, very frequently, the external limiting membrane(19); in the severe forms, the outer nuclear layer may be no longer identifiable and therefore the outer plexiform layer may be in direct contact with Bruch´s membrane.
The thinned retina permits the deeper penetration of light and a corresponding increased signal from the choroid within the atrophic area (Figure 9).
SD OCT is also useful to identify absence of exudative signs (intraretinal or subretinal pockets of fluid, RPE detachments, maintenance of the continuity of Bruch´s membrane)(20).
Several abnormalities have been found with SD OCT in the junction zone(19,21,22), such as disruption of external retinal layers with different shape of band endings, disappearance of the external limiting membrane and/or of the retina encompassing inner segments of the photoreceptor layer to Bruch´s membrane at the same or at a different transverse planes, small elevations of RPE thought to represent subRPE deposits or increased distance between inner and outer photoreceptors segment and RPE, presumably due to debris between these layers.
Smooth margins with no structural changes from normal to abnormal retina exist in the junction zone when there is no FAF abnormality, which underscores the significance of abnormal FAF(22) (Figure 9).
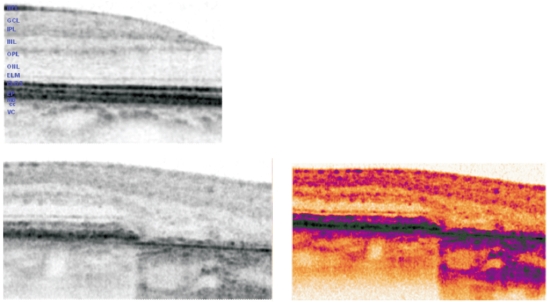
Figure 9 - SD OCT in normal retina (up left ). In the lower images, SD OCT of the junction area between preserved retina and the geographic atrophy. Atrophic areas show retinal thinning due to atrophy of the RPE and disappearance of the external retina that includes inner and outer segment of the photoreceptors and, very frequently, the external limiting membrane(16); The outer nuclear layer may be no longer identifiable and therefore the outer plexiform layer may be in direct contact with Bruch´s membrane. The thinned retina permits the deeper penetration of light and a corresponding increased signal from the choroid within the atrophic area.
In summary, precise quantification of the GA and its progression by fundus autofluorescence imaging and the detailed morphologic study of the external retina by the high resolution SD OCT allow to show the relative slow progressing abnormalities of the outer retinal layers in dry AMD.
This may prove essential for prognostic and interventional strategies, in order to detect potential benefit by slowing down the degenerative process or perhaps detect signs of RPE and/or photoreceptors rescue.
References - Fundus autofluorescence patterns and optical coherence tomography in geographic atrophy secondary to AMD
References - Fundus autofluorescence patterns and optical coherence tomography in geographic atrophy secondary to AMD
- Klein R, Davis MD, Magli YL, Segal P, Klein BE, Hubbard L. The Wisconsin age-related maculopathy grading system. Ophthalmology 1991; 98 (7): 1128-1134.
- Sarks JP, Sarks SH, Killingsworth MC Evolution of geographic atrophy of the retinal pigment epithelium. Eye 1988; 2 ( Pt 5): 552-577.
- Augood CA, Vingerling JR, de Jong PT, Chakravarthy U, Seland J, Soubrane G, Tomazzoli L, Topouzis F, Bentham G, Rahu M, Vioque J, Young IS, Fletcher AE. Prevalence of age-related maculopathy in older Europeans: the European Eye Study (EUREYE). Arch Ophthalmol 2006; 124 (4): 529-535.
- Ferris FL 3rd, Fine SL, Hyman L. Age-related macular degeneration and blindness due to neovascular maculopathy. Arch Ophthalmol 1984; 102 (11): 1640-1642.
- Sunness JS, Margalit E, Srikumaran D, Applegate CA, Tian Y, Perry D, Hawkins BS, Bressler NM. The long-term natural history of geographic atrophy from age-related macular degeneration: enlargement of atrophy and implications for interventional clinical trials. Ophthalmology 2007; 114 (2): 271-277.
- Monés J, Gómez-Ulla F. Degeneración macular asociada a la edad. Prous Science. Barcelone, Espagne. 2005; 467 p.
- Schmitz-Valckenberg S, Fleckenstein M, Scholl HP, Holz FG. Fundus autofluorescence and progression of age-related macular degeneration. Surv Ophthalmol 2009; 54 (1): 96-117.
- Delori FC. Spectrophotometer for non- invasive measurement of intrinsic fluorescence and reflectance of the ocular fundus. Appl Optics 1994; 33 (31): 7429-7452.
- Delori FC, Dorey CK, Staurenghi G, Arend O, Goger DG, Weiter JJ. In vivo fluorescence of the ocular fundus exhibits retinal pigment epithelium lipofuscin characteristics. Invest Ophthalmol Vis Sci 1995; 36 (3): 718-729.
- Holz FG, Schmitz-Valckenberg S, Spaide RF, Bird AC. Atlas of Fundus Autofluorescence Imaging. Springer. Berlin, Allemagne. 2007; 342 p.
- Holz FG, Bellman C, Staudt S, Schütt F, Völcker HE. Fundus autofluorescence and development of geographic atrophy in age-related macular degeneration. Invest Ophthalmol Vis Sci 2001; 42 (5): 1051-1056.
- Hwang JC, Chan JW, Chang S, Smith RT. Predictive value of fundus autofluorescence for development of geographic atrophy in age-related macular degeneration. Invest Ophthalmol Vis Sci2006; 47 (6): 2655-2661.
- Bindewald A, Schmitz-Valckenberg S, Jorzik JJ, Dolar-Szczasny J, Sieber H, Keilhauer C, Weinberger AW, Dithmar S, Pauleikhoff D, Mansmann U, Wolf S, Holz FG. Classification of abnormal fundus autofluorescence patterns in the junctional zone of geographic atrophy in patients with age related macular degeneration. Br J Ophthalmol 2005; 89 (7): 874-878.
- Holz FG, Bindewald-Wittich A, Fleckenstein M, Dreyhaupt J, Scholl HP, Schmitz-Valckenberg S; FAM-Study Group. Progression of geographic atrophy and impact of fundus autofluorescence patterns in age-related macular degeneration. Am J Ophthalmol 2007; 143 (3): 463-472.
- Schmitz-Valckenberg S, Bindewald-Wittich A, Dolar-Szczasny J, Dreyhaupt J, Wolf S, Scholl HP, Holz FG. Correlation between the area of increased autofluorescence surrounding geographic atrophy and disease progression in patients with AMD. Invest Ophthalmol Vis Sci 2006; 47 (6): 2648-2654.
- Scholl HP, Bellmann C, Dandekar SS, Bird AC, Fitzke FW. Photopic and scotopic fine matrix mapping of retinal areas of increased fundus autofluorescence in patients with age-related maculopathy. Invest Ophthalmol Vis Sci 2004; 45 (2): 574-583.
- Schmitz-Valckenberg S, Bültmann S, Dreyhaupt J, Bindewald A, Holz FG, Rohrschneider K. Fundus autofluorescence and fundus perimetry in the junctional zone of geographic atrophy in patients with age-related macular degeneration. Invest Ophthalmol Vis Sci 2004; 45 (12): 4470-4476.
- Wolf-Schnurrbusch UE, Enzmann V, Brinkmann CK, Wolf S. Morphologic changes in patients with geographic atrophy assessed with a novel spectral OCT-SLO combination. Invest Ophthalmol Vis Sci 2008; 49 (7): 3095-3099.
- Coscas G, Coscas F, Vismara S, Zourdani A, Li Calzi CI. Optical coherence tomography in age-related macular degeneration. 1st edition. Springer. Berlin, Allemagne. 2009. 414 p.
- Fleckenstein M, Charbel Issa P, Helb HM, Schmitz-Valckenberg S, Finger RP, Scholl HP, Loeffler KU, Holz FG. High-resolution spectral domain-OCT imaging in geographic atrophy associated with age-related macular degeneration. Invest Ophthalmol Vis Sci 2008; 49 (9): 4137-4144.
- Brar M, Kozak I, Cheng L, Bartsch DU, Yuson R, Nigam N, et al. Correlation between spectral-domain optical coherence tomography and fundus autofluorescence at the margins of geographic atrophy. Am J Ophthalmol 2009; 148 (3): 439-444.